LQG control

So far we have assumed that all the state variables are measured, that is, the knowledge of the current state available to the feedback controller. Oftentimes this is not the case, and only a subset of (possibly even scaled or more generally transformed) state variables is measured. This encoded in the output equation that needs to be considered together with he state equation

\begin{aligned} \dot{\bm{x}} &= \mathbf A\bm x + \mathbf B\bm u,\\ \bm y &= \mathbf C\bm x (+ \mathbf D\bm u). \end{aligned}

Static (proportional) output feedback control

We can now formulate the optimal control problem with the same cost function as in the LQR case, but we require that the optimal controller comes in the form of the optimal output feedback \bm u(t) = - \mathbf K\bm y(t) instead of the state feedback one. It turns out, however, that this is a challenging problem, mainly because the underlying optimization is nonconvex. Some results are available in the literature (for example in [1, Ch. 8]), but here we will take another route.

LQG optimal control

Instead of restricting the output feedback controller to be proportional (just an array of gains), we can accept that it has its own dynamics. But this adds quite some complexity to the problem. Nonetheless, a smart way to deal with this is to decompose the dynamic output feedback control problem into two subproblems:

  • the first one is to estimate the state variables from the measured output,
  • and the second one is to compute the optimal control law based on the estimated state variables.

The latter is just the state feedback control problem that we have just solved within the LQR framework. We have shown that when it comes to the numerical computation of the gains, there is no difference between the deterministic and stochastic versions of the problem.

The former is known as state estimation or state observation, and powerful methods exist. In the deterministic case we can use Luenberger’s observer, in the stochastic case we can use a Kalman filter. Combination of the two is known as Linear Quadratic Gaussian (LQG) control.

Optimal estimation of states

Although we have no ambitions to cover the state estimation methods in detail, because a dedicated course BE3M35OFD exists within our study program, we do provide some basics here so that the structure of the resulting output feedback controller is visible.

We continue our discussion (somewhat arbitrarily) in the continuous time domain. In the deterministic case we consider a linear model of the plant \dot{\bm x} = \mathbf A\bm x + \mathbf B\bm u,\quad \bm y = \mathbf C\bm x, in which we assume that the direct feedthrough term \mathbf D is zero.

We set the observer (estimator) to be of the form

\dot{\hat{\bm{x}}} = \mathbf A\hat{\bm{x}} + \mathbf B\bm u + \underbrace{\mathbf L(\bm y-\mathbf C\hat{\bm{x}})}_{\text{correction}}, which clearly contains a model of the plant, and some correction term that is proportional to the difference between the measured output and the estimated output. The matrix \mathbf L is known as the observer gain(s).

Upon restructuring the right hand side, we can write the observer in the form \boxed{ \dot{\hat{\mathbf{x}}}= \underbrace{\left(\mathbf A-\mathbf L\mathbf C\right)}_{\mathbf{A}_o}\hat{\mathbf{x}} + \mathbf B\mathbf u + \mathbf L\mathbf y}, which emphasizes that the observer has two inputs – the control \bm u and the measured output \bm y, and also that by the choice of the observer gain \mathbf L we can influence the dynamics of the observer. The design of the observer gain \mathbf L can be done using pole placement techniques used in the linear state feedback design: transposing (\mathbf A-\mathbf L\mathbf C) gives (\mathbf A^\top-\mathbf C^\top \mathbf L^\top), which has the same structure (\mathbf A-\mathbf B\mathbf K) encountered in the pole placement problem.

Here we aim for a method based on optimization. We can formulate such optimal estimation problem within the stochastic setting. The plant is \begin{aligned} \dot{\bm{x}}(t) &= \mathbf A\bm x(t) + \mathbf B \bm u(t) + \mathbf B_w {\color{red}\bm w(t)}\\ \bm y(t) &= \mathbf C \bm x(t) + {\color{red}\bm v(t)} \end{aligned} where \bm w(t) and \bm v(t) are white noises with spectral densities \mathbf S_w and \mathbf S_v, respectively.

Optimal estimator design is dual to the state feedback design. If an infinite time horizon is considered, the ARE needs to be solved for \mathbf P_e(\infty) \mathbf 0 = \mathbf A\mathbf P_e(\infty) + \mathbf P_e(\infty)\mathbf A^\top + \mathbf B_w\mathbf S_w\mathbf B_w^\top - \mathbf P_e(\infty)\mathbf C^\top \mathbf S_v^{-1}\mathbf C\mathbf P_e(\infty), where \mathbf P_e(t) = \mathbf{E}\left\{[\mathbf x(t)-\hat{\mathbf{x}}(t)][\mathbf{x}(t)-\hat{\mathbf{x}}(t)]^\top \right\}.

The cost function to be minimized is the “size” of \mathbf P_e(\infty): \operatorname{Tr}\mathbf P_e(\infty) = \mathbf{E}\left\{[\mathbf x(\infty)-\hat{\mathbf{x}}(\infty)]^\top[\mathbf{x}(\infty)-\hat{\mathbf{x}}(\infty)] \right\}, that is, the mean square error (MSE) of the state estimate.

The optimal observer gain is given by \mathbf L = \mathbf P_e(\infty)\mathbf C^\top \mathbf S_v^{-1}.

Example 1 (Kalman filter) Estimate the range and radial velocity of an aircraft from noisy radar measurements. The model is \begin{bmatrix} \dot r(t) \\ \ddot r(t) \end{bmatrix} = \begin{bmatrix} 0 & 1\\ 0 & 0 \end{bmatrix} \begin{bmatrix} r(t) \\ \dot r(t) \end{bmatrix} + \begin{bmatrix} 0 \\ 1 \end{bmatrix} w(t), where r(t) is the actual range of the aircraft, and w(t) is a random process that models the unknown phenomena affecting the acceleration of the aircraft. The range measurements are given y(t) = \begin{bmatrix} 1 & 0 \end{bmatrix} \begin{bmatrix} r(t) \\ \dot r(t) \end{bmatrix} + v(t), where v(t) is a measurement noise.

The initial state is \begin{bmatrix} r(0) \\ \dot r(0) \end{bmatrix} = \begin{bmatrix} 10 000\, \text{m}\\ -150\, \text{m/s} \end{bmatrix}

The two random processes are assumed to be uncorreleated white noises with the following spectral densities S_w = 4\,\frac{\text{m}^2}{\text{s}^4 \text{Hz}},\quad S_v = 10^4\,\frac{\text{m}^2}{\text{Hz}}.

The covariance of the initial estimation error is \mathbf P_e(0) = \begin{bmatrix}10^6 \text{m}^2 & 0\\ 0 & 4\times 10^5 \text{m}^2/\text{s}^2\end{bmatrix}

#TODO

LQG optimal control – combined Kalman filtering and LQR state feedback

Now that we also know how to estimate the state, we are all set. The combination of the state estimator (Kalman filter) and the proportional state feedback controller is shown in Fig. 1.

Figure 1: LQG controller in an output feedback loop

The computation of the two components is done separately, each consisting of solving their own (continuous-time) ARE, that is, two AREs altogether.

Note that while we use low-level solvers in the code below, dedicated high-level functions are available not only for computing the LQR regulator and Kalman filter, but also the resulting LQG controller, see the section on software.

Example 2 (Satellite tracking antenna with noisy measurements of angle)  

Show the code
using ControlSystems: ss, lqr
using DifferentialEquations
using LinearAlgebra # For identity matrix I
using MatrixEquations: arec
using Plots
using SparseArrays
using Random
Random.seed!(1234) # For reproducibility

# Model of the plant
A = [0.0 1.0; 0.0 -0.1] 
B = [0.0, 0.001] 
Bw = [0.0, 0.001] 
C = [1.0 0.0] 
G = ss(A,[B Bw],C,0)

# Model of the stochastic disturbance and measurement noise
Sw = 5000.0   # Spectral density (N^2 m^2 / Hz)
Sv = 1.0      # Noise spectral density (deg^2/Hz)

# Design of the LQR controller
q1 = 180.0 
Q1 = [q1 0.0; 0.0 0.0]
R1 = 1.0
K = lqr(G[:,1],Q1,R1)     # LQR controller gain

# Design of the Kalman filter
#L = kalman(G[:,2],Sw,Sv) # Beware that they assume the plant in the form dx/dt = Ax + Bu + w, that is, Bw=I.
P, cleigvals = arec(A', C'/Sv*C, Bw*Sw*Bw')
L = P*C'/Sv               # Kalman filter gain

# Initial state for the closed-loop system, that is, both the plant state and the observer error state
x₀ = [2.0, -1.0]
x̂₀ = [0.0, 0.0]
e₀ = x₀ - x̂₀
xe₀ = vcat(x₀, e₀)

# Simulation of the response of the closed-loop system to random disturbance and noise. 
# The problem must be formulated as a stochastic differential equation (SDE) problem.
# See https://docs.sciml.ai/DiffEqDocs/stable/types/sde_types/.

function f!(dxe, xe, p, t) 
   dxe .= [A-B*K B*K; zeros(Float64,2,2) A-L*C]*xe  
end

function g!(dxe, xe, p, t)
   dxe .= [Bw*sqrt(Sw) zeros(Float64,2,1); Bw*sqrt(Sw) -L*sqrt(Sv)]
end

N = zeros(4, 2)     # This encodes the random process structure in the SDE, 
N[2, 1] = 1         # see https://docs.sciml.ai/DiffEqDocs/stable/tutorials/sde_example/#Example-4:-Systems-of-SDEs-with-Non-Diagonal-Noise
N[4, 1] = 1
N[3, 2] = 1
N[4, 2] = 1
N = sparse(N)       

# Simulation parameters
dt = 1 // 2^(4)
tspan = (0.0, 100.0)

# Creating and solving the SDE problem
prob = SDEProblem(f!, g!, xe₀, tspan, noise_rate_prototype = N)
sol = solve(prob, SRA1(), dt = dt)      # Not all SDE solvers can be used here, non-diagonal solvers needed.

# Computging the control input
u = [-K K]*sol[1:4,:]

# Plotting the results
p1 = plot(sol.t,sol[1:2,:]',lw=2, lab=["Angle (deg)" "Angular rate (deg/s)"], xlabel="Time [s]", ylabel="State", title="")
p2 = plot(sol.t, u', lw=2, xlabel="Time [s]", ylabel="Control", title="",label="Torque (Nm)")
plot(p1, p2, layout=(2,1), size=(800,600))
Figure 2: Simulation of a response a LQG-controlled satellite tracking antenna a nonzero initial state, and a random disturbing torque modelled by a white noise process. The measurement of the angle is corrupted by a measurement noise modelled by a white noise process as well.

Stability margins of LQG

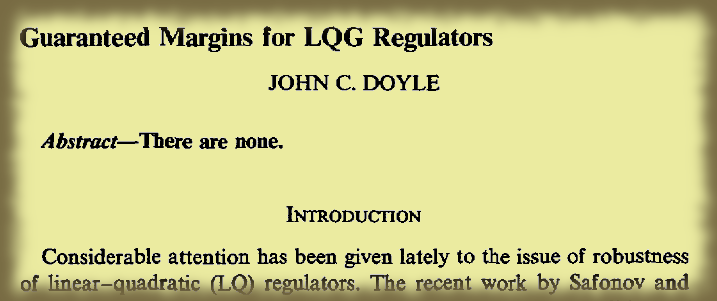
We have seen previously that the LQR enjoys remarkable guarantees on the gain and phase margins of the closed-loop system. Sadly, the LQG does not exhibit such property. A concise summary of the situation was given by John Doyle in 1978 in his famous paper [2]:

Figure 3: Screenshot of “the shortest abstract in any IEEE journal ever”

Example 3 (GM and PM of LQG can be arbitrarily small) This is the example from [2]. \begin{aligned} \dot{\bm{x}}(t) &= \begin{bmatrix}1 & 1\\0 & 1\end{bmatrix}\bm x(t)+\begin{bmatrix}0\\1\end{bmatrix}u(t) +\begin{bmatrix}1\\1\end{bmatrix}w(t),\\ y(t) &= \begin{bmatrix}1 & 0\end{bmatrix}\bm x(t)+v(t)\\ \mathbf Q&=\begin{bmatrix}10&10\\10&10\end{bmatrix},\quad R=1,\\ S_w&=10,\quad S_v=1. \end{aligned}

Show the code
using ControlSystems: ss, lqr, kalman, marginplot, nyquistplot
using DifferentialEquations
using LinearAlgebra # For identity matrix I
using MatrixEquations: arec
using Plots

A = [1.0 1.0; 0.0 1.0] 
B = [0.0, 1.0] 
Bw = [1.0, 1.0] 
Bv = [0.0, 0.0] 
C = [1.0 0.0] 
D = 0.0 
Dw = 0.0 
Dv = 1.0

G = ss(A,[B Bw Bv],C,[D Dw Dv])

q1 = 10.0 
Q1 = q1*[1 1; 1 1]
R1 = 1.0
K = lqr(G[:,1],Q1,R1)

Q2 = 10
R2 = 1
#L = kalman(G[:,1:2],Q2,R2)
P, cleigvals = arec(A', C'/Sv*C, Bw*Sw*Bw')
L = P*C'/Sv               # Kalman filter gain


R_lqg = ss(A-L*C-B*K,L,K,0)     # LQG controller
L_lqg = R_lqg*G[:,1]            # Open-loop transfer function with the LQG controller

marginplot(L_lqg,lw=2)
Figure 4: Bode plot of the closed-loop system with LQG controller that demonstrates mediocre gain and phase margins

And the Nyquist plot of the closed-loop system is

Show the code
nyquistplot(L_lqg,title="",xlabel="Real",ylabel="Imaginary",label="",lw=2,aspect_ratio=1)
Warning: Keyword argument hover not supported with Plots.GRBackend().  Choose from: annotationcolor, annotationfontfamily, annotationfontsize, annotationhalign, annotationrotation, annotations, annotationvalign, arrow, aspect_ratio, axis, background_color, background_color_inside, background_color_outside, background_color_subplot, bar_width, bins, bottom_margin, camera, clims, color_palette, colorbar, colorbar_entry, colorbar_scale, colorbar_title, colorbar_titlefont, colorbar_titlefontcolor, colorbar_titlefontrotation, colorbar_titlefontsize, connections, contour_labels, discrete_values, fill, fill_z, fillalpha, fillcolor, fillrange, fillstyle, flip, fontfamily, fontfamily_subplot, foreground_color, foreground_color_axis, foreground_color_border, foreground_color_grid, foreground_color_subplot, foreground_color_text, formatter, framestyle, grid, gridalpha, gridlinewidth, gridstyle, group, guide, guidefont, guidefontcolor, guidefontfamily, guidefonthalign, guidefontrotation, guidefontsize, guidefontvalign, html_output_format, inset_subplots, label, layout, left_margin, legend_background_color, legend_column, legend_font, legend_font_color, legend_font_family, legend_font_halign, legend_font_pointsize, legend_font_rotation, legend_font_valign, legend_foreground_color, legend_position, legend_title, legend_title_font_color, legend_title_font_family, legend_title_font_pointsize, legend_title_font_rotation, legend_title_font_valigm, levels, lims, line, line_z, linealpha, linecolor, linestyle, linewidth, link, margin, marker_z, markeralpha, markercolor, markershape, markersize, markerstrokealpha, markerstrokecolor, markerstrokewidth, minorgrid, minorgridalpha, minorgridlinewidth, minorgridstyle, minorticks, mirror, normalize, orientation, overwrite_figure, permute, plot_title, plot_titlefontcolor, plot_titlefontfamily, plot_titlefontrotation, plot_titlefontsize, plot_titlelocation, plot_titlevspan, polar, primary, projection, quiver, ribbon, right_margin, rotation, scale, series_annotations, seriesalpha, seriescolor, seriestype, show, show_empty_bins, showaxis, size, smooth, subplot, subplot_index, thickness_scaling, tick_direction, tickfontcolor, tickfontfamily, tickfonthalign, tickfontrotation, tickfontsize, tickfontvalign, ticks, title, titlefontcolor, titlefontfamily, titlefonthalign, titlefontrotation, titlefontsize, titlefontvalign, top_margin, unitformat, weights, widen, window_title, x, xdiscrete_values, xerror, xflip, xforeground_color_axis, xforeground_color_border, xforeground_color_grid, xforeground_color_text, xformatter, xgrid, xgridalpha, xgridlinewidth, xgridstyle, xguide, xguidefontcolor, xguidefontfamily, xguidefonthalign, xguidefontrotation, xguidefontsize, xguidefontvalign, xlims, xlink, xminorgrid, xminorgridalpha, xminorgridlinewidth, xminorgridstyle, xminorticks, xmirror, xrotation, xscale, xshowaxis, xtick_direction, xtickfontcolor, xtickfontfamily, xtickfonthalign, xtickfontrotation, xtickfontsize, xtickfontvalign, xticks, xunitformat, xwiden, y, ydiscrete_values, yerror, yflip, yforeground_color_axis, yforeground_color_border, yforeground_color_grid, yforeground_color_text, yformatter, ygrid, ygridalpha, ygridlinewidth, ygridstyle, yguide, yguidefontcolor, yguidefontfamily, yguidefonthalign, yguidefontrotation, yguidefontsize, yguidefontvalign, ylims, ylink, yminorgrid, yminorgridalpha, yminorgridlinewidth, yminorgridstyle, yminorticks, ymirror, yrotation, yscale, yshowaxis, ytick_direction, ytickfontcolor, ytickfontfamily, ytickfonthalign, ytickfontrotation, ytickfontsize, ytickfontvalign, yticks, yunitformat, ywiden, z, z_order, zdiscrete_values, zerror, zflip, zforeground_color_axis, zforeground_color_border, zforeground_color_grid, zforeground_color_text, zformatter, zgrid, zgridalpha, zgridlinewidth, zgridstyle, zguide, zguidefontcolor, zguidefontfamily, zguidefonthalign, zguidefontrotation, zguidefontsize, zguidefontvalign, zlims, zlink, zminorgrid, zminorgridalpha, zminorgridlinewidth, zminorgridstyle, zminorticks, zmirror, zrotation, zscale, zshowaxis, ztick_direction, ztickfontcolor, ztickfontfamily, ztickfonthalign, ztickfontrotation, ztickfontsize, ztickfontvalign, zticks, zunitformat, zwiden
@ Plots ~/.julia/packages/Plots/MR7sb/src/args.jl:1557
Figure 5: Nyquist plot of the closed-loop system with LQG controller that demonstrates mediocre gain and phase margins

We have just seen by means of an example that the gain and phase margins of the closed-loop system with LQG controller can be arbitrarily small. After learning the nearly magical property of the LQR, it may be disappointing to see that LQG does not share it. This lead to developments of new methods that would guarantee the stability margins, or robustness in a broader sense. We start with a minor modification of the LQG controller, which is known as a Loop Transfer Recovery (LTR) controller.

Back to top

References

[1]
F. L. Lewis, D. Vrabie, and V. L. Syrmo, Optimal Control, 3rd ed. John Wiley & Sons, 2012. Accessed: Mar. 09, 2022. [Online]. Available: https://lewisgroup.uta.edu/FL%20books/Lewis%20optimal%20control%203rd%20edition%202012.pdf
[2]
J. Doyle, “Guaranteed margins for LQG regulators,” IEEE Transactions on Automatic Control, vol. 23, no. 4, pp. 756–757, Aug. 1978, doi: 10.1109/TAC.1978.1101812.